THE MICROMOBILITY PROJECT @ HUNTER COLLEGE SOCIOLOGY JANUARY 2026
Mike Owen Benediktsson, Ph.D., Xuemeng Li, Ph.D., Danielle Hoang, and Keith James
Overview
New York City is in the midst of a micromobility “revolution” (Quistberg & Rodriguez 2025). The number of lightweight, two-wheeled vehicles on city streets has multiplied in recent years, thanks to lithium battery technology, an expanded network of bike lanes, and a boom in the app-based restaurant delivery industry. The potential economic, environmental, and public health benefits of this moment are clear. In places where micromobility vehicles can be substituted for vehicles with internal combustion engines, they will cut transportation costs, relieve traffic congestion, and decrease harmful emissions. But other aspects of micromobility are still uncertain. Questions remain about the safety implications of hundreds of thousands of bicycles, e-bikes, mopeds, and scooters navigating congested NYC streets under a variety of traffic conditions. According to a recent report by the New York City Comptroller’s office, a “sense of chaos” has accompanied the growth of micromobility (Bharadwaj, Levers & Yeung 2024). Understanding micromobility is a prerequisite to reducing the chaos and promoting safe and orderly conditions on city streets.
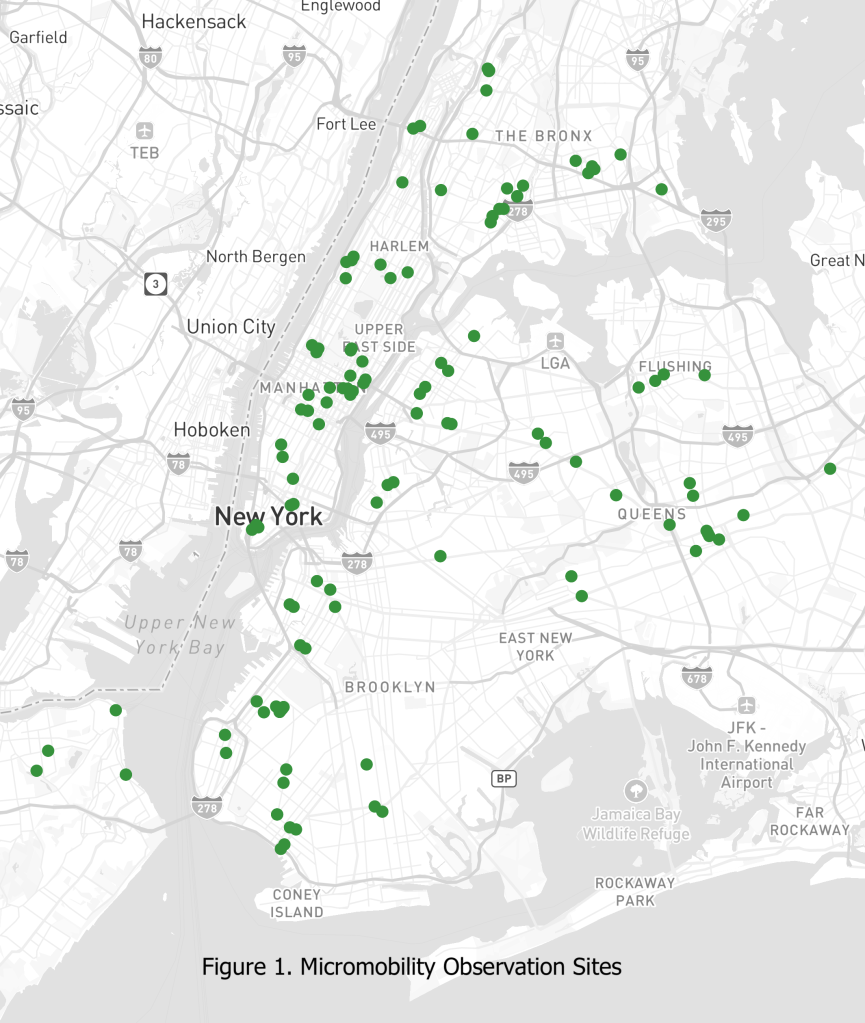
This report offers a statistical snapshot of micromobility across the city over a three-week period in late 2025. Our team of trained researchers systematically observed over 1,700 micromobility vehicles at 155 separate intersections across the five boroughs of New York City. Our primary findings describe overall patterns in the demographics of micromobility and vehicle behavior at city intersections, and show how this behavior is shaped by variations in infrastructure as well as individual-level attributes.
Key Findings:
- Our research shows that protected bike lanes make micromobility not just safer, but more predictable. When protected bike lanes are available, more than four-out-of-five micromobility vehicles will occupy these lanes, and almost no vehicles will travel on public sidewalks. We also found evidence that protected bike lanes help to “calm” micromobility traffic, encouraging more orderly behavior at intersections.
- We found that delivery workers are safer and more law-abiding riders than non-commercial riders. Our results show strong, consistent differences in the risk-tolerance and law-abidingness of commercial riders, or delivery workers, who were significantly less likely than non-commercial riders to engage in problematic behaviors such as running red lights, speeding, and riding against the direction of traffic. Delivery workers were also far more likely to yield to pedestrians at congested intersections, and were less likely to ride on sidewalks.
- We found that the demography of micromobility is divided and unequal. Women were massively underrepresented among micromobility riders. Delivery workers, who made up nearly 50% of the riders we observed, are overwhelmingly men of color, where non-commercial micromobility riders are disproportionately white. These results point toward divisions and inequities within the social landscape of micromobility that have implications for transportation planning, as well as regulation and enforcement.
Background
Over the last decade, micromobility has become a primary mode of transportation for an increasing cross-section of New Yorkers. Over a recent three-year period, e-bike ownership tripled in the city (New York City Council 2024). The current intensity of micromobility is evident from remote sensor data gathered by the New York City Department of Transportation (NYCDOT). In 2025, more than 1 million micromobility vehicles passed through a single midtown intersection; over the same period, approximately 2.5 million micromobility vehicle trips were made across the Williamsburg Bridge, or roughly 7,000 trips per day (New York City Department of Transportation 2025a).
A fundamental question prompted by this trend concerns the demographic parameters of micromobility; are the benefits and costs of micromobility shared across lines of race, gender, or socioeconomics? For a growing sector of the labor market, micromobility offers a means of making a living, as app-based delivery of restaurant food has flourished since before the start of the COVID-19 pandemic. The New York City Department of Consumer and Worker Protection (NYCDCWP) estimates that delivery workers made roughly 2.77 million food deliveries per week in early 2024, and the overwhelming majority of these deliveries were made via bicycle or e-bike (New York City Department of Consumer and Worker Protection 2024). The regulation of this industry is at best uneven. The City Council recently raised the minimum wage for delivery workers to parallel or exceed the wage for equivalent types of work, but there is abundant evidence of exploitative and unsafe practices by employers, for example, placing pressure on delivery workers to ride at unsafe speeds in order to meet delivery quotas (Figueroa et. al. 2023), or hiding the tip option from consumers and thus denying workers’ the compensation they deserve (Haag 2025). The number of commercial micromobility vehicles on city streets seems likely to continue to grow, as app-based restaurant delivery services show no signs of declining in popularity.
The benefits of micromobility are not limited to the economy. Bicycles, e-bikes, etc. have a clear payoff for public health and environmental quality and sustainability, helping to cut congestion and harmful motor vehicle emissions in densely-populated urban neighborhoods. Still, micromobility is not without risk. The addition of hundreds of thousands of two-wheeled motorized and un-motorized vehicles to city streets increases the threat of collisions with both motor vehicles and pedestrians. In 2023, bicycle and e-bike deaths in New York City reached a 24-year high, before declining in the past two years (New York City Department of Transportation 2025b).
At the heart of safety concerns surrounding motorized (typically electric) micromobility vehicles are several aspects of rider behavior. First, e-bikes and mopeds allow riders to travel at greater speeds than conventional bicycles, and, due to the additional weight of these vehicles incurred by a battery, even an incremental increase in speed can produce significantly greater risk of injury or death. For this reason, the speed of micromobility vehicles has become a flashpoint for public controversy and policy change. Citing the risk of e-bike related collisions on city streets, former mayor Eric Adams instituted a 15-mph speed limit for e-bikes that went into effect in late October 2025, a measure that has been broadly criticized by micromobility advocates (Keh 2025).
The second aspect of micromobility that raises safety concerns has to do with a set of behaviors that increase the likelihood of collisions with pedestrians, motor vehicles, or other micromobility vehicles. The smaller size of micromobility vehicles makes it possible to ride on the sidewalk, ride against traffic, or run through red lights, which is problematic,particularly when intersections are congested with motor vehicles or pedestrian traffic. As cities around the world have faced mounting political pressure to regulate micromobility traffic, these behaviors have become targets of changes in local traffic ordinances or enforcement measures (Maag 2025).
A recent editorial in the American Journal of Public Health notes that improved public safety will require improved data:
It is impossible to address many of the safety issues surrounding micromobility without adequate data about the users (e.g., age, gender, race/ethnicity), user density and frequency, where they ride, and comprehensive collision data… Regular, consistent measurement of use would help researchers, advocates, and policymakers make better decisions about how to more fully integrate these modes into the mobility offerings of cities. (Quistberg & Rodriguez 2025)
At the same time, micromobility data is difficult to produce. Advancements in remote sensing capability and machine learning tools may change this, but for now, directly observing micromobility in real-world urban contexts remains time-consuming and labor intensive. This study seeks to make a contribution by providing data that we hope will add to the public understanding of micromobility in New York City at this moment in time.
Methodology
This study employed a quantitative, observational research design to systematically document micromobility vehicles and rider behavior at street intersections in New York City. Data collection took place over a three-week period during the Fall of 2025 and relied on structured, direct observations conducted by trained volunteers. The goal of the methodology was to capture real-world micromobility behavior across a wide range of urban contexts, traffic conditions, and temporal patterns. Observations were conducted at 155 unique intersections distributed across all five boroughs of New York City. All intersections were signalized (i.e. controlled by a traffic signal).
In other respects, the intersections where we conducted observations represented a variety of sizes and configurations. In the Bronx and Brooklyn the majority of our observations (71.43% and 53.85% respectively) did not have bike lanes of any kind, whereas only around one-third of our observations in Manhattan and Queens were in locations that lacked bike lanes. Meanwhile, designated bikelane signals were virtually non-existent at the locations we observed outside of Manhattan. But inside the borough of Manhattan slightly more than half of the locations (52.50%) had designated bike signals. [We found that rider behavior may vary by borough, reflective of these differences (see Table 3 in the next section for details)].
To account for temporal variation in travel behavior, observations were distributed across three time periods: weekday evening rush hours (5:00 p.m. to 9:00 p.m.), weekday non-rush periods, and weekends. This sampling strategy was intended to capture differences in micromobility use associated with food delivery, commuting, recreational travel, and varying levels of general traffic congestion.
A total of 56 volunteers participated as observers. All volunteers completed a course of training prior to data collection, either in person or remotely via Zoom. Training sessions focused on ensuring consistency and reliability in observation and classification. Observers were instructed on how to identify and categorize different types of micromobility vehicles, including bicycles, e-bikes, mopeds, motorcycles, scooters, e-scooters, skateboards, and other modes that fell outside of these categories.
Observers conducted systematic, direct observations from a fixed vantage point at each intersection, randomizing their observations with regard to the micromobility vehicles that passed through the
| Table 1. Observations by Borough and Infrastructure | |||||
| Bronx | Brooklyn | Manhattan | Queens | Staten Island | |
| Bike Lanes: | |||||
| No Bike Lanes | 71.43% | 53.85% | 33.45% | 32.22% | 16.67% |
| Painted and Protected Lanes | 5.71% | 11.54% | 14.61% | 17.15% | 0% |
| Painted Bike Lanes Only | 20% | 28.61% | 21.30% | 25.73% | 83.33% |
| Protected Bike Lanes | 2.86% | 6.01% | 30.63% | 24.90% | 0% |
| 100% | 100% | 100% | 100% | 100% | |
| Designated Bike Signals: | |||||
| Yes | 0% | 0.52% | 52.50% | 24.43% | 0% |
| No | 100% | 99.48% | 47.50% | 75.57% | 100% |
| 100% | 100% | 100% | 100% | 100% | |
intersection during each half-hour observation period. Each observed micromobility vehicle and rider constituted a single observation. In addition to structured variables, open-ended response fields were included to capture qualitative contextual information. Observers used these fields to document factors such as congestion levels, crowding at intersections, weather conditions, and other situational elements that could influence micromobility behavior.
In total, 1,736 micromobility vehicles were documented during the study period. Observations were logged in real time using mobile phones. Data were collected using a pair of linked questionnaires created in Qualtrics software. One questionnaire captured location-level attributes, while the second captured vehicle- and rider-level attributes. This design allowed observers to efficiently associate multiple vehicle observations with a single intersection while minimizing data entry redundancy. To improve accuracy in estimating travel speed, observers were trained using video footage of micromobility vehicles traveling at known speeds. This footage was used to help observers distinguish between vehicles traveling at greater than or less than 15 miles per hour, a behavioral indicator in the study. Observers were also trained to recognize and record interactions between micromobility riders and pedestrians, particularly in crosswalks and bike lanes.
The primary dependent variables consisted of behavioral indicators observed at intersections. These included the vehicle’s action at traffic signals and crosswalks (e.g., stopping, pausing, yielding, or proceeding), the predominant location of the vehicle within the roadway configuration (e.g., travel lane, bike lane, sidewalk), estimated travel speed (greater than or less than 15 mph), and the rider’s response to pedestrians crossing the roadway or bike lane. Independent variables included characteristics of the intersection, such as the specific location, number of traffic lanes, and presence and type of bike lanes. Vehicle and rider characteristics included the type of micromobility device, safety equipment, the attributed reason for travel (delivery vs. leisure or commuting), and attributed gender and attributed race/ethnicity, based on observer perception, consistent with common practices in observational traffic safety research.[1] Data were reviewed following collection to identify incomplete or inconsistent entries prior to analysis. Analysis was conducted using a combination of R, STATA, and Qualtrics.
Findings
Frequency tables for selected variables are presented in Appendix A. Overall they show that while unpowered bicycles remain the most common micromobility vehicle, powered vehicles such as e-bikes, mopeds, and e-scooters together account for more than 50% of the micromobility traffic we observed. Roughly 40% of the micromobility vehicles we observed were commercial vehicles ridden by delivery workers or couriers. This may be a conservative number, as observers were relying for this categorization on visible equipment used for commercial purposes, such as insulated bags, or mittens. In cases where a delivery worker was riding back to a restaurant or store after delivering a shopping back to an apartment or house, our observers may have coded them incorrectly as non-commercial.
Our observations show micromobility to be largely orderly. More than three-quarters of micromobility vehicles were in the places we would expect them to be: in bike lanes or in traffic lanes when bike lanes are not available. Less than 10% were on sidewalks. More than half of the riders we observed were wearing helmets, more than half were riding at slow or moderate speeds, and approximately 49% stopped and waited at red lights, while an additional 28% slowed or stopped at red signals, presumably to ensure conditions were safe, before proceeding through the light, a behavior that, although technically illegal, much as jaywalking was until 2025, is not necessarily unsafe. In less than 4% of cases did we observe micromobility vehicles riding through active pedestrian crossings and forcing pedestrians to yield or be struck. In general, micromobility appears to be patterned and predictable. The remainder of this section points to several specific findings revealed by our data.
Protected bike lanes make micromobility more orderly and predictable.
The results of our study underscore that, perhaps unsurprisingly, rider behavior is strongly influenced by the availability of a bike lane, and the type of bike lane that is available. But the ways in which bike lanes shape behavior are more complex than we might assume. Protected bike lanes, which are separated from lanes of traffic by physical barriers or spatial buffers, formalize the section of the roadway that belongs to micromobility vehicles. They provide a sense of safety, but they also seem to “calm” micromobility traffic, making it more orderly and predictable. Painted bike lanes, in contrast, seem to have the opposite effect, perhaps due to the ability of vehicles to move in and out of the lanes, creating chaos and ambiguity.
When riders have the option to travel in a protected lane, they overwhelmingly take it – in locations with a protected bike lane, roughly 85% of the vehicles we observed were utilizing the lane. Moreover, when there is a protected bike lane available, less than 3% of riders use the sidewalk. In locations with painted, as opposed to protected bike lanes, the percentage of riders in the lane drops to 55.5%, still a majority, but one that leaves 38.1% of micromobility traffic in motor vehicle lanes and another 7.4% on the sidewalk. In locations where there is no bike lane at all, the percentage of micromobility riders on the sidewalk increases drastically, to about 1 in 6 riders (12.9%). These figures offer strong evidence that riders move onto sidewalks when they do not feel adequately protected in the roadway.
The story becomes more complicated, however, when we look at other ways in which bike lanes shape rider behavior. At intersections, the presence of a protected bike lane leads to safer and more orderly behavior on the part of micromobility riders, who are less likely to run red lights at speed (without pausing or slowing) (21%) and more likely to yield to pedestrians (70%) than when there is a painted lane or no lane available. Painted bike lanes seem to have the opposite effect, leading to the highest rates of running red lights at speed (36%) and the lowest rates of yielding to pedestrians (58%). Finally, the absence of any bike lanes leads to rates of running red lights and yielding to pedestrians that are in-between the other two categories, but closer to the numbers in protected lanes.
| Table 2. Bike Lanes and Micromobility Behavior | ||||
| Micromobility Infrastructure at Location | ||||
| No Bike Lane | Painted Lane | Protected Lane | ||
| Location of Vehicle: | n=824 | n=500 | n=338 | |
| Bike Lane | – | 54.5% | 84.7% | |
| Traffic Lane (outside of bike lane) | – | 38.1% | 12.4% | |
| Sidewalk | 12.9% | 7.4% | 2.8% | |
| Traffic Lane (no bike lane) | 87.1% | – | – | |
| 100.0% | 100.0% | 100.0% | ||
| Behavior at Red Lights: | ||||
| Continued Through Light at Speed | 26.1% | 35.5% | 21.1% | |
| Paused / Slowed then Continued | 28.5% | 18.4% | 31.8% | |
| Stopped and Waited for Green | 45.5% | 46.1% | 47.1% | |
| 100.0% | 100.0% | 100.0% | ||
| Behavior at Congested Crossings: | ||||
| Yielded to Pedestrians | 68.8% | 58.1% | 69.7% | |
| Did Not Yield | 31.3% | 41.9% | 30.3% | |
| 100.0% | 100.0% | 100.0% | ||
| Speed When Observed: | ||||
| Slow to medium (1-15 mph) | 76.6% | 72.2% | 73.5% | |
| Fast (More than 15 mph) | 23.4% | 27.8% | 26.5% | |
| 100.0% | 100.0% | 100.0% | ||
| Illegal Bike Lane Use: | ||||
| Moped in Bike Lane | – | 5.3% | 1.5% | |
| Non-Moped or Moped in Traffic Lane | 94.7% | 98.5% | ||
| 100.0% | 100.0% | 100.0% | ||
These results are slightly counterintuitive, but they are too large to be the result of chance and are statistically significant (P<.01). Our interpretation is that painted bike lanes create conditions that are dynamic and ambiguous, as micromobility vehicles and motor vehicles are free to physically move in and out of spaces that are designated for other modes. It has been well documented, for example, that painted bike lanes in the city are frequently blocked by motor vehicles, which forces micromobility into traffic lanes (Arnav 2023). This material fact likely explains the higher incidence of mopeds utilizing painted bike lanes than protected bike lanes. (Mopeds are legally barred from bike lanes in the city.) The informality and lack of protection offered by painted lanes may embolden micromobility riders to disregard traffic laws and norms at intersections at higher rates. Putting these speculative explanations aside, the data clearly show that protected bike lanes foster the most predictable, orderly conditions on city streets where there is a sizable amount of micromobility traffic. Other measures, or no measures, invite riders onto the sidewalk and into traffic lanes.
Delivery workers are safer and more law-abiding riders.
The explosive growth of the app-based restaurant industry in recent years, which received a boost from the restricted mobility of consumers in the peak Covid-19 years of 2020 and 2021, has corresponded with the popularization of e-bikes and electric mopeds, and for this reason alone, public concern over safety has implicitly or explicitly targeted commercial micromobility riders. Our results indicated that any implication that delivery workers are less safe than non-commercial riders is misplaced. Delivery workers were found to be more observant of traffic laws and safety norms on nearly every behavioral variable, and in every case except two, these differences were statistically significant. Figure 1 depicts these differences, showing the probability of a range of problematic behaviors, and contrasting delivery workers with all other categories of micromobility riders.
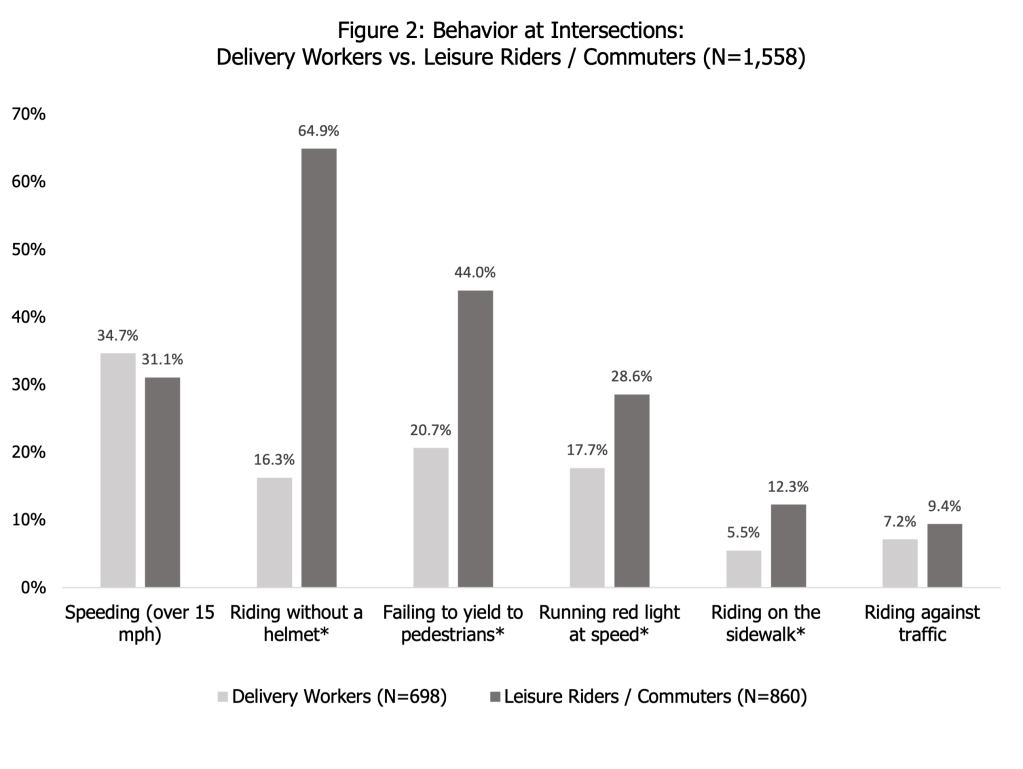
As the chart illustrates, delivery workers were less likely to ride without a helmet, less likely to fail to yield to pedestrians, less likely to run red lights without slowing down or pausing, or “at speed,” and were less likely to ride on the sidewalk. When delivery workers and non-commercial riders arrive at an intersection with a red light, they demonstrate significantly different patterns of behavior. In general, roughly 58% of the non-commercial riders who we observed who arrived at an intersection when the light was red eventually proceeded through the red light. Half of these riders (29%) stopped or paused to ensure the conditions were safe before proceeding, and the other half (29%) continued through red lights at speed.
In sharp contrast, the majority of delivery workers (55%) stop at red lights and wait for them to turn green. Approximately 27% stopped or paused and then continued. Only 18%, or less than 1-in-5, were observed running red lights at speed. Delivery riders were also significantly less likely (5%) to ride on the sidewalk than non-commercial riders (12%) and were much more likely to yield to pedestrians when they were crossing. In roughly four-out-of-five cases (79%) where pedestrians were crossing the street or the bike lane, delivery riders yielded. Non-commercial riders, in contrast, yielded just over half the time (56%) in this scenario. Finally, commercial riders were slightly more likely to travel at speeds higher than 15 mph than non-commercial riders (35% vs. 31%) and less likely to ride against traffic when in motor vehicle lanes (7% vs. 9%), but both differences failed conventional tests of statistical significance.[2]
3) Risks Compound by Rider
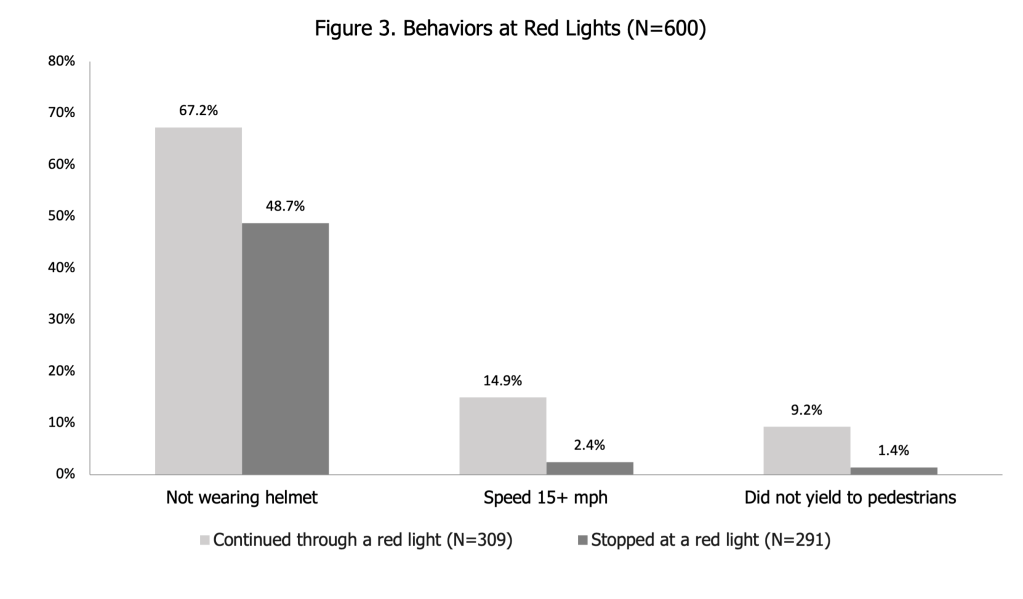
This suggests that risk may be compounded by riders who have a higher tolerance for risk, as evidenced by not wearing a helmet. When risk-taking riders run through red lights, they are likely to be travelling faster than typical among micromobility vehicles. Speed in such cases could be either a cause or an effect of running the light, as fast-moving micromobility vehicles will have more trouble stopping when the light turns red and as riders may speed up to try to get through a yellow light before it turns. Because they are already traveling through the light at speed, these riders are also less likely to be able to yield to any pedestrians who have already moved onto the roadway at the crosswalk. Our data seem to imply that risk may be compounded in situations where risk-taking riders arrive at congested intersections after the light has turned, and when pedestrians have already moved into the street. If accurate, this insight could help planners and traffic law enforcers target their preventative efforts aimed at reducing micromobility-pedestrian collisions.
4) Micromobility Demographics and Geography: Divided, Uneven, Unequal
Our final set of findings focuses on the demographics of micromobility, as documented by our field observations. Tables 2 and 3 show that the population of micromobility riders we observed was uneven with regard to race, gender, and occupation. It is important to acknowledge that our data in no way represent a “census” of micromobility vehicles or riders in the city. First, we used visible cues such as skin tone and clothing to estimate the gender, racial, and ethnic identity of the micromobility riders we observed, rather than basing our data on survey responses asking riders how they prefer to identify.[3] Secondly, our sample of intersections was not geographically representative, and our sample of micromobility riders, though random with regard to the vehicles passing through an intersection at a given time, was not random in relation to the broader population of micromobility users across the city. Having said that, we believe our data offer a useful, if incomplete, demographic portrait of micromobility riders at over 150 locations in the city in late October / early November 2025.
| Table 3. Micromobility by Race/Ethnicity and Purpose of Travel | ||||
| Delivery | Non-Commercial | Total | NYC (2020) | |
| Person of color | 82.5% | 49.8% | 62.6% | 69.10% |
| White | 1.7% | 36.6% | 20.4% | 30.90% |
| Undetermined | 15.8% | 13.4% | 17.1% | – |
| 100.0% | 100.0% | 100.0% | 100.0% | |
Table 4 shows the racial demographics of delivery vs. non-commercial micromobility, and compares these figures to the racial breakdown in New York City as a whole. Immediately clear from the data is the fact that the micromobility delivery industry is overwhelmingly comprised by people of color (POC). Even if we made the very conservative assumption that half of the riders whose race we could not discern were white, then 9-out-of-10 commercial micromobility riders would be POC. In contrast, only 49.8% of non-commercial riders we observed were determined to be POC, a figure that is roughly 20 percentage points lower than the New York City population as a whole. The upshot of these findings is that there are two socially distinct cross-sections of micromobility riders: one disproportionately POC who ride bicycles, e-bikes, and mopeds for a living; and the other disproportionately white, who ride for leisure and recreation or to commute to work.[4] This is an oversimplification, and is hardly surprising, but it reinforces an argument that the urban planning, regulation, and enforcement of micromobility should not, and cannot, be one-size-fits-all.
| Table 4. Micromobility by Gender and Race/Ethnicity | ||||
| Person of color | White | Total | NYC 2020 (Female/Male)[5] | |
| Men | 92.8% | 75.8% | 89.0% | 47.5% |
| Women | 7.1% | 23.6% | 10.0% | 52.5% |
| Non-binary / Uncertain | 0.1% | 0.6% | 1.1% | – |
| 100.0% | 100.0% | 100.0% | 100.0% | |
This takeaway is similarly underscored by Table 5, which breaks down micromobility by race and gender. Overall, 1-out-of-10 of the riders we observed were women, a figure that falls massively short of the population percentage in New York City. This finding hints at powerful underlying cultural, psychological, and social factors that may discourage women from engaging in micromobility. Interestingly, the racial distribution among the women we observed was roughly 50/50, which suggests that on balance, white women are more likely to ride micromobility vehicles than women of color. For the NYCDOT and other public actors and agencies that have a stake in micromobility, the data suggest there is much work to do in establishing conditions, whether material, economic, cultural, or social, that will increase the percentage of the city’s women who are willing and able to take advantage of the transportation opportunities that bicycles, e-bikes, etc. offer. As previously mentioned, rider behavior may vary by borough due to differences in road conditions, such as the availability of bike lanes and the presence of bike lane signals. Categorizing 1,700 cases by borough (Table 3), we found that Manhattan (45.05%) and Queens (42.56%) have the highest percentage of delivery workers riding on the road. Manhattan (60.07%) and Queens (59.75%) also show the highest percentages of riders not wearing helmets. Manhattan has the highest percentage of reckless behaviors: 26.37% for speeding and 5.36% for failing to yield to pedestrians. Every borough shows a relatively similar number of riders running red lights, with the Bronx showing the highest percentage (25.71%) and Brooklyn showing the lowest (20.96%). These figures suggest that the geography of micromobility as well as its demography is uneven.
| Table 5. Rider Behaviors by Boroughs of New York City | |||||
| Bronx | Brooklyn | Manhattan | Queens | Staten Island[6] | |
| Without a helmet | 50.7% | 52.5% | 60.1% | 59.8% | 61.1% |
| Speed 15+ mph | 10.7% | 21.9% | 26.4% | 15.9% | 61.1% |
| No yield to pedestrians | 2.2% | 3.4% | 5.4% | 2.8% | 0.0% |
| Signal lights violation | 25.7% | 21.0% | 22.3% | 24.1% | 11.1% |
| Delivery Workers | 37.1% | 35.8% | 45.1% | 42.6% | 27.8% |
Conclusion
Micromobility has become a world of its own in New York City. Even on the coldest and wettest of winter days, tens of thousands of two-wheeled vehicles move through the city, delivering people and things where they need to go. The research presented here hopefully sheds a bit more light on this world, in a way that is helpful to the people whose job it is to make urban transportation safer, more efficient, and more just. Our research suggests that installing protected bike lanes versus painted bike lanes is likely to reward the additional investment of time, effort, and money. The “sense of chaos” described by micromobility’s detractors, as well as the “mode rage” experienced by drivers and pedestrians toward errant e-bikes seem likely to be exacerbated by the confusing scenarios in which micromobility vehicles, pedestrians, and motor vehicles compete for the same space. When an e-bike invades pedestrian territory on the sidewalk, or a motor vehicle intrudes on a bike lane, the sense of safety and order that these spaces promise is sabotaged. Protected bike lanes reduce the ambiguity concerning who belongs where, and the payoff of this, according to our data, is a more orderly traffic ecosystem at intersections across the city, in which there are virtually no micromobility vehicles on the sidewalk and in which collisions with motor vehicles or pedestrians at intersections are less likely.
The consistent finding that delivery workers are safer and more orderly riders than their non-commercial counterparts should help regulators target their efforts more efficiently. Although behavioral variations between material contexts and across demographic categories are evidence of life experiences and thought processes that we did not observe directly, our intuition is that delivery workers are safer riders than non-commercial riders for two straightforward reasons: 1) They are far more experienced, riding micromobility vehicles for many hours every working day; 2) They have more to lose from minor collisions that would damage the machine with which they make a living and more to lose from enforcement actions by traffic police, should they be stopped running a light or riding dangerously. We speculate that delivery drivers are safer riders, in other words, for much the same reasons that professionals in many lines of work are more methodical and risk averse than amateurs.
In a similar fashion, we suppose that risk informs the decisions of people of color to engage in micromobility at lower rates than white New Yorkers. Investment in bicycle-oriented infrastructure in the city has historically favored Manhattan and the most proximate outer-borough neighborhoods, which are also, not coincidentally, among the city’s most gentrified communities. Although our observations covered many areas of the city where people of color make up overwhelming majorities, the overall tendency that we observed was for people of color to engage in recreational or otherwise optional micromobility at lower rates than white New Yorkers. It seems likely that in many outer-borough neighborhoods further from Manhattan, micromobility seems less safe and less appealing due to a paucity of bike infrastructure and other riders to help calm traffic, which results in micromobility landscapes that are dominated by delivery riders.
We suspect that women also might be more inclined to be micromobile if they felt safer. They were more likely to ride on sidewalks than men, but the difference did not rise to statistical significance due to the smallness of our sample of woman micromobility riders. Nevertheless, this may serve as a clue to be followed up on by future researchers, planners and policymakers who would like to solve the apparent gender gap in micromobility. For micromobility to fulfill its promise in the city, making transportation cleaner, less expensive, more efficient, and far more environmentally sustainable, the benefits of micromobility will need to be broadly shared.
References
Arnav, B. (2023, April 6). “Cops in NYC ticket only 2% of blocked bike lanes: Analysis.” Streetsblog New York City. https://nyc.streetsblog.org/2023/04/06/nypd-tickets-fewer-than-2-of-blocked-bike-lane-complaints-analysis
Bharadwaj, S., Levers, A., & Yeung, L. (2024, October 29). “Street safety in the era of micromobility” (Office of the New York City Comptroller Report). Office of the New York City Comptroller. https://comptroller.nyc.gov/wp-content/uploads/documents/10.29.24-Micromobility-Report.pdf
Burford KG, Itzkowitz NG, Rundle AG, DiMaggio C, Mooney SJ. “The burden of injuries associated with e-bikes, powered scooters, hoverboards, and bicycles in the United States: 2019–2022.” Am J Public Health. 2024;114(12):1365–1374.
Figueroa, M., Guallpa, L., Wolf, A., Tsitouras, G., & Colón-Hernandez, H. (2023). “Essential but unprotected: App-based food couriers in New York City.” Cornell University Industrial and Labor Relations School & Workers’ Justice Project. https://ecommons.cornell.edu/items/7236a5cb-ebf7-4629-bf02-505efd1ce1d5
Haag, Matthew. (2025. December 17) “Uber and DoorDash Try to Halt N.Y.C. Law That Encourages Tipping”. New York Times. Section A, 24.
Keh, Andrew. (2025) “Throttling Their Street Thrills”. New York Times. Nov. 2, 2025, Section MB, 1.
Maag, C. (2025, June 1). “Drivers Who Run Red Lights Get Tickets. E-Bike Riders Get Court Dates”, The New York Times, Section MB, p. 1.
New York City Council. (2024, December 10). E-bikes, mopeds and scooters: Micromobility in New York City (Micromobility report). NYC Council. https://council.nyc.gov/gale-brewer/wp-content/uploads/sites/90/2024/12/12-10-2024-Micromobility-Report.pdf
New York City Department of Consumer and Worker Protection. (2024). Restaurant delivery app data: January–March 2024. NYC Department of Consumer and Worker Protection. https://www.nyc.gov/assets/dca/downloads/pdf/workers/Restaurant-Delivery-App-Data-Q1-2024.pdf
New York City Department of Transportation. (2025a). Bike network and ridership. NYC DOT. Retrieved January 10, 2026, from https://www.nyc.gov/html/dot/html/bicyclists/bikestats.shtml#counts
New York City Department of Transportation. (2025b, July 2). Vision Zero: NYC DOT announces traffic deaths reached lowest level in recorded history during the first six months of 2025, fatalities down 32 percent from last year[Press release]. NYC DOT. https://www.nyc.gov/assets/bic/downloads/pdf/pr/pr-visionzero-lowest-deaths-recorded-in-program-history.pdf
Quistberg DA, and Rodriguez DA (2025). “Planning and accommodating the micromobility revolution and its impact on public health.” American Journal of Public Health. 2025;115(1):15–17.
Acknowledgements
We would like to thank our enthusiastic and committed volunteer observers at the Hunter College Department of Sociology:
Mariana Abril
Megan Agyemang
Mymoon Akter
William Akunevicz
Rashni Alam
Marcos Altamirano
Eugenia Medina Aquino
Jhonathan Ayala
Sabiqunahar Begam
Frances Bruschi
Jasmine Buri
Kaylee Castillo
Kaitlyn Chan
Lindsey Cortes
Michelle Dmitrenko
Chantal Downer
Sarah El-Masry
Catalina Galvan
Kristhalyn Garcia
Ahasan Habib
Teagan Helsing
Zion Hendricks-Miller
Ahmed Ibrahik
Ahmed Ibrahim
Sarah Isa
Mabel Jimenez
Paul Kamuf
Taieeb Kashem
Alif Kazi
Lidia Layme
Justin Le
Ivy Lin
Aaron Liu
Sharae Mclean
Shakira McRae
Makayla Metellus
Alms Meza
Maya Nair
Astou Ndoye
Ive Ortiz
Luisa Pellettieri
Brianna Rivas
Darlin Santos Quiroz
Jason Seda
Aria Shahbazpour Shahbazi
Lily Shat
Sophia Snyth
Lana Soetomo
Mabel Sosa
Anay Tellez
Gladys Toomer
notes
[1] Delivery workers identified by equipment commonly associated with commercial micromobility (i.e. bags, carriers, insulated mittens, etc.) Due to the limitations in attributed racial / ethnic identification, we used a simple binary racial/ethnic classification delineating people of color from white micromobility riders. Observers were encouraged to use the “uncertain” option to minimize inaccuracy.
[2] In order to test whether the differences between the behaviors of delivery workers and non-commercial riders are “spurious”, or due to underlying differences in other variables, such as the time of day or week, or the type of micromobility vehicle used, we ran multiple logistic regression models including every possible control variable in our data, and for most of the dependent variables discussed, the delivery / non-commercial effect remain robust and statistically significant at p<0.05.
[3] We adopted a simple racial/ethnic schema in acknowledgement that external attributions of race and ethnicity are necessarily crude and unreliable. Moreover, observers were instructed to be very conservative in their attributions of race, ethnicity, and gender, defaulting to the “Undetermined” and “Uncertain” categories whenever their certainty was less than 100% certain. As a result, approximately one-in-six riders were uncategorized with regard to race and ethnicity, but we have a reasonably high degree of confidence in our observer’s attributions in the other 82.5%.
[4] In fact, there are many different communities of micromobility riders in the city, which includes people who bicycle for fitness, teenagers who ride bikes or e-bikes to school, skateboarders who gravitate toward specific public spaces where they are tolerated or at least not ticketed, and so forth. We use broad brush strokes here due to the limitations of our data and the empirical fact that our study suggests the two largest classes of micromobility riders at this point in time are, effectively, delivery workers and non-commercial riders, and these classes are demographically very distinct.
[5] The U.S. Census Bureau does not categorize the population with regard to gender. Here we use sex as a highly imperfect proxy for gender, as it is the only statistical reference point available for the gender distribution in the city.
[6] Only 18 cases observed in Staten Island. The results are excluded for written analysis to avoid over-generalized conclusions.
